Football Outsiders DVOA Visualized
UPDATE: The visualization has been updated for Week 16.
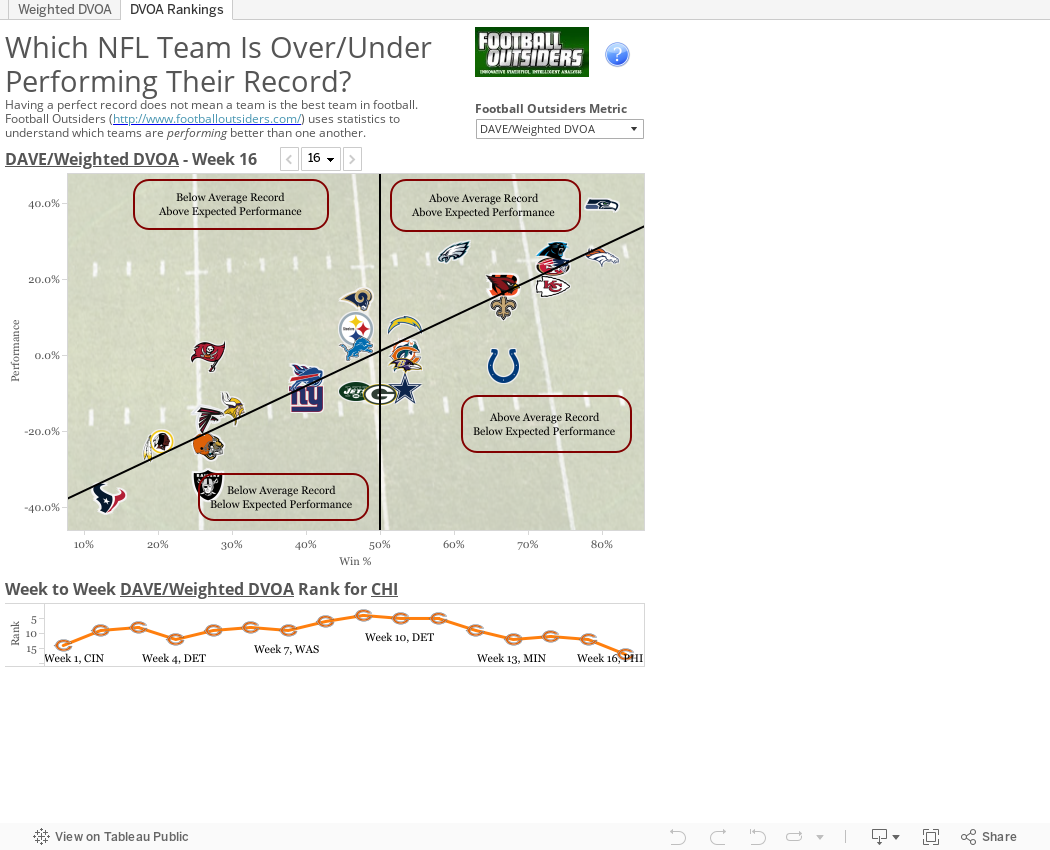
Football Outsiders is a website dedicated to statistically understanding how different football teams perform when adjusted for the strength of their opponents. The specifics of DVOA can be found on their site, but in general, the stat shows how a team will perform on each down and whether they will be able to move the ball progressively down the field (or stop the ball on defense). A positive DVOA is better than a negative DVOA, except on defense where a negative DVOA is better than positive.
However, a team's performance is not always reflected in their record. A team (Team A) with few losses may have that record because they are winning close games and playing weak opponents. On the other hand, a different team (Team B) that has a worse record may have faced tougher opponents but lost close games, but are winning big when they do win. In this case Team B would probably have a better DVOA than Team A, and would be more likely to beat Team A in a game.
I have taken that data that Football Outsiders has prepared and visualized it in Tableau Public, which allows users to interact with the data to find out more information about their team. Feel free to select your favorite team and learn more about their performance.