Showing posts with label Data. Show all posts

Thursday, October 30, 2014

My Favorite Tableau Trick For Work: MIN(1)

Many of us found +Tableau Software from the work that we do in our day jobs, and have since taken our passions to our free time.  When given the ability to build visualizations we're passionate about, people come up with creative solutions like Anya A'Hearn's Stairs Of The City, KK Molugu's Playoff Quarterback Touchdowns, Russell Spangler's Bacon Viz (and WAY too many more to mention).  

HOWEVER...

In our day jobs, there is much less room to be creative and more of a need to be direct.  As a result, designs usually involve displaying more numbers than visualizations.  And while there are best practices by Nelson Davis about when to use numbers and when to use visuals, numbers end up more often than us 'creative types' would prefer.  


FEAR NOT!

You can still let loose your creative side even when displaying numbers.  My personal favorite trick is the MIN(Number of Records) trick, or simply MIN(1).  You can create the field like so, and then set the default aggregation to MIN



You can create a new field or simply use 'Number of Records' that is in default Tableau
Set the default aggregation to Minimum to make ongoing use easier

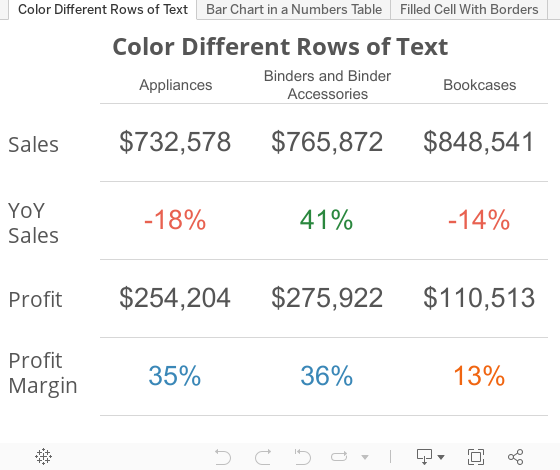
And get results like this


WHAT?!


MIN(1) is a calculated field that you can create that give you a measure in your worksheet that acts as a place holder for other measures.  You can then add whatever measure, or combination of measures, to the text charm of your field and display that in a very organized fashion.

???????????
An example then.

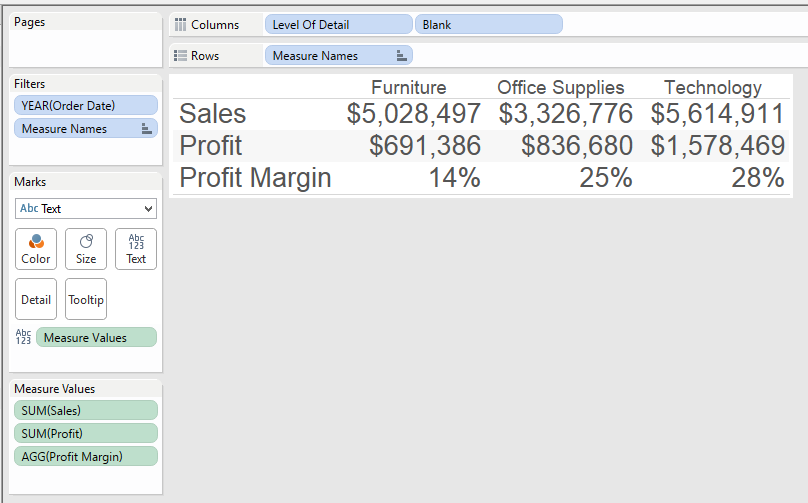
Normally, if we wanted to show a series of numbers on a sheet, we put 'Measure Names' in the rows, 'Measure Values' in the Text, and it would look something like this....

But if you want to color just the Profit Margin line, based on a set percentage of 20%, you can't.  An attempt would make your result looks something like this...

However, using MIN(1), you can set placeholders for each of the measures and then analyze them however you want.  Here's the same sheet, redesigned....


Notice how I've dragged four copies of 1 on the screen that show up as MIN(1) because that is the default aggregation I have set.  Every row is now on a scale of 0-2, with 1 dead in the middle, but more importantly it provides it's own measure to color, size, give level of detail, etc.  Now I can just color the Profit Margin line by itself and leave the other lines alone.


NOT ENOUGH, YOU SAY?!
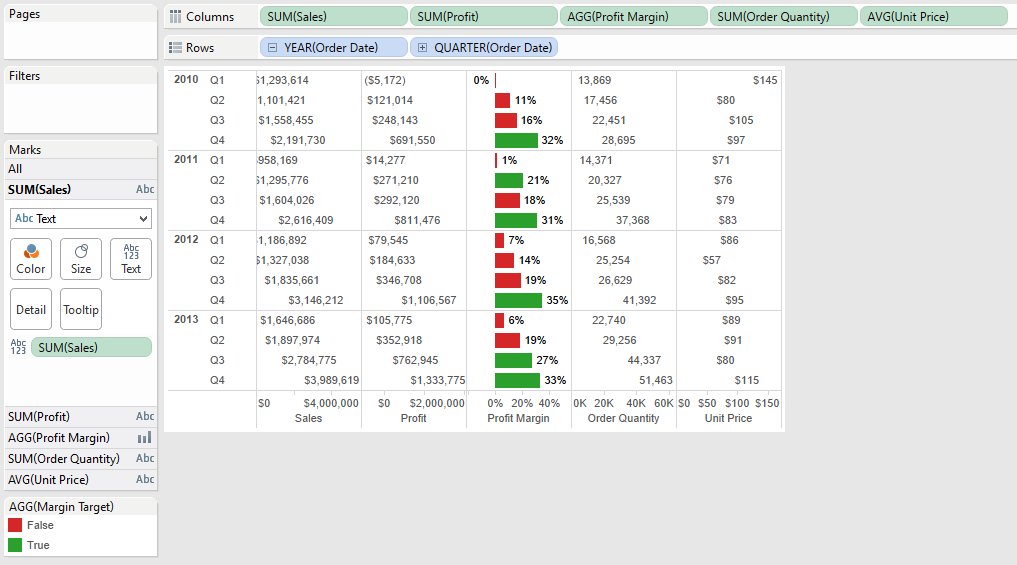
What about combination charts, a chart that shows both bars and text.  If we try the traditional example again, we get something like this.

While we are able to achieve both text and charts, the text is aligning to the value it represents thus making it hard to read the numbers.  Now let's' rebuild this using MIN(1)

The result is that the numbers are all aligned for each metric, a bar chart is in the middle for the specific metric worth highlighting, they are still separate measures which allows us to edit color, size, and level of detail, with an overall clean look.

UPDATE:  Steven Carter wrote a post to do filled cell conditional formatting with text.  Forcing the cell lengths and using Gantt charts you can now have a look that is similar to Excel (for helping people transition away from it)
Way to go Steven!
In addition in both cases, because this is all done in 1 chart there is one query back to the data source, and if you have too many values to fit on the screen, you can SCROLL (!!!!!) and know that one scroll will move all of the fields necessary.


ONE MORE EXAMPLE

I was working with a customer where on a dashboard, we wanted a way to highlight the number of alerts that people needed to pay attention to.  To make it stand out, I put the number in a text box with a highlighted background and a border. 

Using MIN(1) as a bar chart and setting the range from 0 to 1, I can set the border on the bar chart, change the background color based on any value you want.  All of this is happening while also never having to worry about the bar chart range.  Here's what the sheet looks like.


CONCLUSION

If you're building a dashboard and need to display numbers in some capacity, MIN(1) is another tool in your Swiss Army Knife of Tableau skills.  It allows you clean layouts but with all of the customization we've come to know and love using Tableau. 

Please comment or tweet at me (@DanRMonty) with other ways you've found you can use MIN(1)!


DISCLAIMER: you do need to have text fields on your dashboard now to label your measures (you can put them in a container to make it easier to manage).  You can see this in the dashboard above.

Thursday, April 24, 2014

Tableau Data Blending with No Common Dimensions

Sometimes when you're working with data, there is a need to compare datasets that don't really have anything in common.  This issue came up with my Sports Viz Show Me The Money: I had a dataset that contained the top 100 earning athletes in 2013 and I wanted to show what their pay could buy for them at an individual item level with out creating an unnecessary Cartesian product..  
Athlete data: a single row per athlete
As Gru would say: Light bulb!  If I create a data set containing a row for each purchasable item repeated the maximum amount of times it would appear (aka the number of times the top earning athlete, in this case Tiger Woods, would be able to purchase it), then I could write a calculated field that blended the two sources and did my filtering for me.

Stuff to buy data: note there is no column mentioning athlete
Doing this gave me two data sets: one that was 100 rows deep and the other just over 5,000 rows deep.

Next, after bringing in both data sets into Tableau, I created a cross dataset calculated field on the 'Stuff to Purchase' dataset that would allow me to filter out when the number of items exceeded the athletes pay.
running_sum(sum([Cost]))<=sum([Forbes 100 Athletes].[Pay $])
This way when I add the purchase able items at a data level, it will continue to referenced the accumulated value of the purchases and restrict them to only total that is less than the salary of the specified athlete.

Finally, I added
- RowID into the details
- 'How Many' true false filter to the filter section
    - IMPORTANT: Change the 'Compute Using' to use RowID
- Add the purchase category and item to the filter section
- Added the object's description to shape
- Filtered it for the specified athlete (from the secondary source).
   - This ultimately ended up being a quick filter that allowed me to select different athletes

Now I had my sheet that showed each of the items that the person could buy.
 If I had joined them ahead of time, I would have had a Cartesian product of over 160,000 rows!  This not only saved me data space, but also cut down on the data prep I needed to get dashboard built.  

So the answer all along (to the question that was never asked) was yes, it will blend...even if there are no common dimensions.  Let me know if you have any other questions and feel free to comment.  Thank you!

Tuesday, January 14, 2014

Defense vs Offense: A Chicago Bears Coaching Transition

In January 2013, the +Chicago Bears  made the largest coaching philosophy transition when they fired Lovie Smith after a 10-6 season and hired Marc Trestman from the CFL.  

How did their back-to-back seasons compare? Check out the viz below for more information.

UPDATE: As pointed out by my brother +Matt Montgomery , there are two other reasons to be excited for the +Chicago Bears that I will try to incorporate into the viz.
1. Top Offenses > Top Defenses via AdvancedNFLStats
2. Offense is more consistent than Defense, year to year via FootballOutsiders

Monday, December 16, 2013

A Single Pixel (Or Hide) Can Save Your Tableau Viz

UPDATE: After posting this in the Tableau Tips and Tricks community, +Shawn Wallwork pointed out an alternative to my solution that is built right into Tableau.  It was a lesson for me, so I wanted to share it here as well.

While working on my Mike Ditka dashboard (here and on Tableau Public), I had an interesting idea for 'Da Coach' viz: While showing a timeline of a particular coaches season records over time, I would also indicate if the coach had won a Super Bowl that year.

I had found a great site that had images of the Super Bowl logos and used a Chrome extension to download all of the them.  After making a shapes folder for the Super Bowl images in my Tableau Repository, I mapping the images to the coach-season combination that was appropriate.  This layered on top of a line chart started to become....

Ugh...so close, yet so far away
not what I was hoping for.  There were far more 'Null' values than images to display, and if I made the sizing smaller, the Super Bowl logos would not show up.

NEW METHOD: Tableau builds in a way to accomplish hiding the unwanted shapes.  

First, select (left click) the shape you want to hide.  This is CRITICAL because jumping this step will not get you the menu options you want.

Second, right click on the object you want to hide and check 'Hide'
REMEMBER: You will only see this option if you select the object to hide first!

If you ever need to see the data that you have hidden, you can select the drop down of the shape card, and select 'Show Hidden Data'

This accomplishes the same task as the original method, while also providing some additional space in the Viz.  But be sure to remember what you've hidden so you don't loose track of your data. 

ORIGINAL METHOD: Epiphany: what if I made the image for 'Null' values a single pixel?  That way, it will be so small it won't be seen as an image, and even if I need to make it bigger, it still will not be noticed.  
Sure enough, a website hosts an image of a transparent single pixel.  After downloading the image and saving it to my shapes folder, it was easy enough to assign: just hovering over they general area Tableau gave me a easy-to-select box.
Selecting a transparent single pixel inside of Tableau
Worksheet updated!

In the end this gave me the worksheet I was hoping for all along.  Maybe this will help you too in your next viz!  Take care.


Saturday, November 16, 2013

Football Outsiders DVOA Visualized

Football Outsiders DVOA Visualized

UPDATE: The visualization has been updated for Week 16.

Football Outsiders is a website dedicated to statistically understanding how different football teams perform when adjusted for the strength of their opponents.  The specifics of DVOA can be found on their site, but in general, the stat shows how a team will perform on each down and whether they will be able to move the ball progressively down the field (or stop the ball on defense).  A positive DVOA is better than a negative DVOA, except on defense where a negative DVOA is better than positive.  

However, a team's performance is not always reflected in their record.  A team (Team A) with few losses may have that record because they are winning close games and playing weak opponents.  On the other hand, a different team (Team B) that has a worse record may have faced tougher opponents but lost close games, but are winning big when they do win.  In this case Team B would probably have a better DVOA than Team A, and would be more likely to beat Team A in a game.

I have taken that data that Football Outsiders has prepared and visualized it in Tableau Public, which allows users to interact with the data to find out more information about their team.  Feel free to select your favorite team and learn more about their performance.