Showing posts with label Tableau Public. Show all posts

Thursday, October 30, 2014

My Favorite Tableau Trick For Work: MIN(1)

Many of us found +Tableau Software from the work that we do in our day jobs, and have since taken our passions to our free time.  When given the ability to build visualizations we're passionate about, people come up with creative solutions like Anya A'Hearn's Stairs Of The City, KK Molugu's Playoff Quarterback Touchdowns, Russell Spangler's Bacon Viz (and WAY too many more to mention).  

HOWEVER...

In our day jobs, there is much less room to be creative and more of a need to be direct.  As a result, designs usually involve displaying more numbers than visualizations.  And while there are best practices by Nelson Davis about when to use numbers and when to use visuals, numbers end up more often than us 'creative types' would prefer.  


FEAR NOT!

You can still let loose your creative side even when displaying numbers.  My personal favorite trick is the MIN(Number of Records) trick, or simply MIN(1).  You can create the field like so, and then set the default aggregation to MIN



You can create a new field or simply use 'Number of Records' that is in default Tableau
Set the default aggregation to Minimum to make ongoing use easier

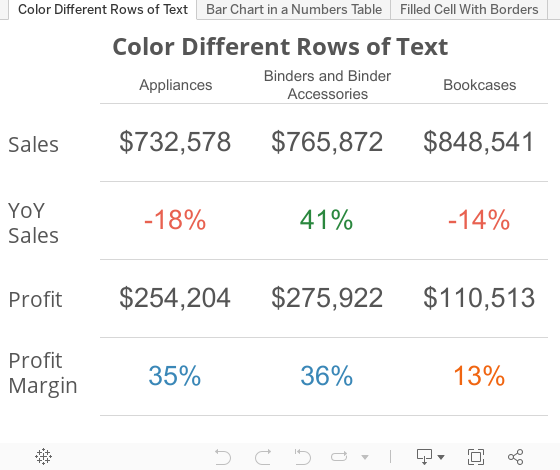
And get results like this


WHAT?!


MIN(1) is a calculated field that you can create that give you a measure in your worksheet that acts as a place holder for other measures.  You can then add whatever measure, or combination of measures, to the text charm of your field and display that in a very organized fashion.

???????????
An example then.

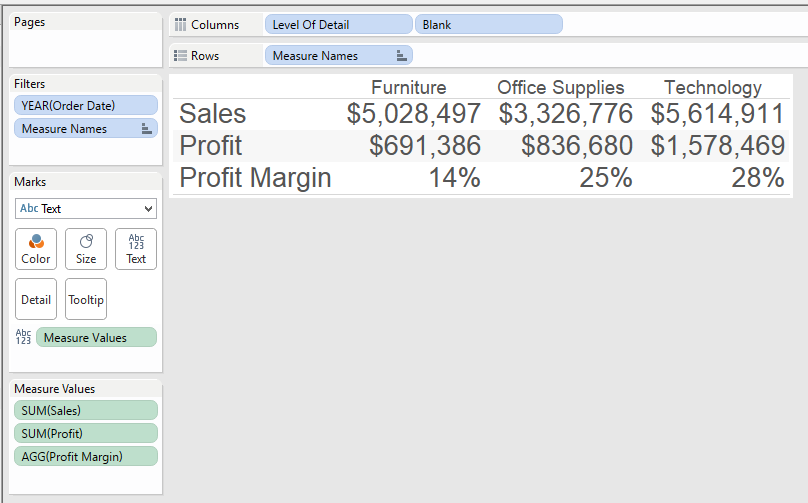
Normally, if we wanted to show a series of numbers on a sheet, we put 'Measure Names' in the rows, 'Measure Values' in the Text, and it would look something like this....

But if you want to color just the Profit Margin line, based on a set percentage of 20%, you can't.  An attempt would make your result looks something like this...

However, using MIN(1), you can set placeholders for each of the measures and then analyze them however you want.  Here's the same sheet, redesigned....


Notice how I've dragged four copies of 1 on the screen that show up as MIN(1) because that is the default aggregation I have set.  Every row is now on a scale of 0-2, with 1 dead in the middle, but more importantly it provides it's own measure to color, size, give level of detail, etc.  Now I can just color the Profit Margin line by itself and leave the other lines alone.


NOT ENOUGH, YOU SAY?!
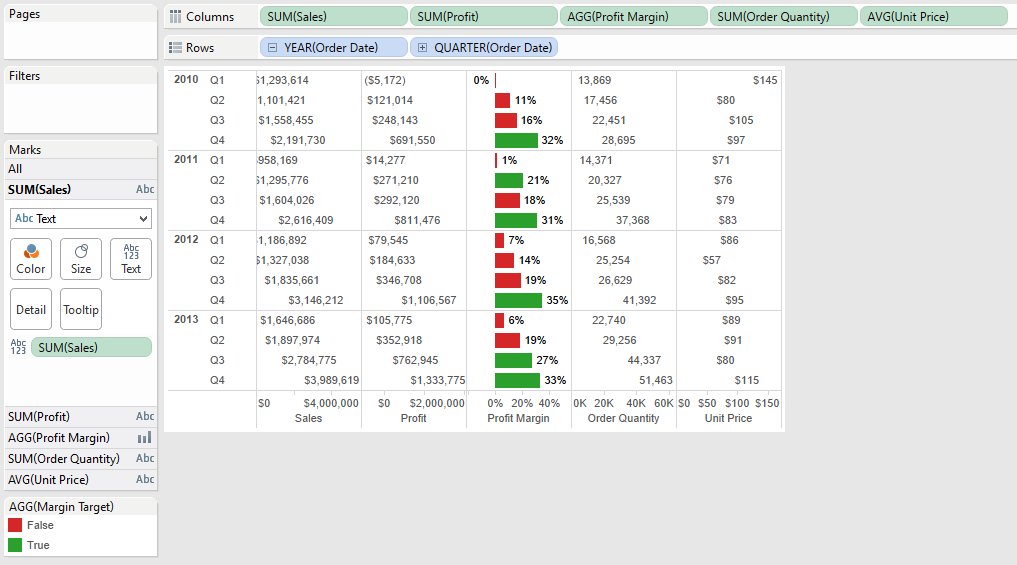
What about combination charts, a chart that shows both bars and text.  If we try the traditional example again, we get something like this.

While we are able to achieve both text and charts, the text is aligning to the value it represents thus making it hard to read the numbers.  Now let's' rebuild this using MIN(1)

The result is that the numbers are all aligned for each metric, a bar chart is in the middle for the specific metric worth highlighting, they are still separate measures which allows us to edit color, size, and level of detail, with an overall clean look.

UPDATE:  Steven Carter wrote a post to do filled cell conditional formatting with text.  Forcing the cell lengths and using Gantt charts you can now have a look that is similar to Excel (for helping people transition away from it)
Way to go Steven!
In addition in both cases, because this is all done in 1 chart there is one query back to the data source, and if you have too many values to fit on the screen, you can SCROLL (!!!!!) and know that one scroll will move all of the fields necessary.


ONE MORE EXAMPLE

I was working with a customer where on a dashboard, we wanted a way to highlight the number of alerts that people needed to pay attention to.  To make it stand out, I put the number in a text box with a highlighted background and a border. 

Using MIN(1) as a bar chart and setting the range from 0 to 1, I can set the border on the bar chart, change the background color based on any value you want.  All of this is happening while also never having to worry about the bar chart range.  Here's what the sheet looks like.


CONCLUSION

If you're building a dashboard and need to display numbers in some capacity, MIN(1) is another tool in your Swiss Army Knife of Tableau skills.  It allows you clean layouts but with all of the customization we've come to know and love using Tableau. 

Please comment or tweet at me (@DanRMonty) with other ways you've found you can use MIN(1)!


DISCLAIMER: you do need to have text fields on your dashboard now to label your measures (you can put them in a container to make it easier to manage).  You can see this in the dashboard above.

Sunday, September 28, 2014

How to auto-scale and auto-arrange shapes/visuals in Tableau

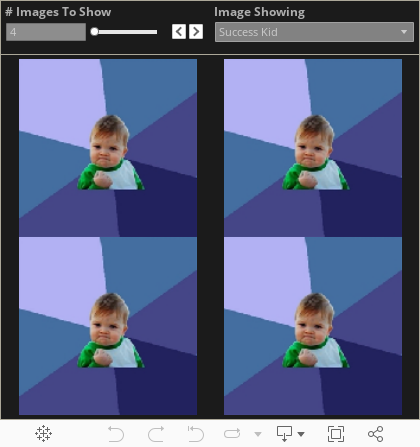
I ran into a unique problem when I built my sports viz a while back.  I had this idea to show a picture for every value of a metric.  However, when I sized the sheet to fit the maximum allowable values, any less than the maximum showed a large amount of white space. (I've since updated the sports viz with this article's trick)  

Then my friend Steven Carter released his viz titled "The Adoption Gap" (and subsequently won Viz of the Day) where he took my picture idea to the next level with his household grid.  Using formulas, he was able to set a grid, and then show a gradually filled in house to represent the number of adoptions needed.

AND THEN Chris Luv released his viz explaining INDEX() and SIZE(), two incredibly valuable table calculations in tableau to determine size and position of a point.  Using INDEX and SIZE, he was able to completely recalculate row and column values on the fly, removing a lot of constraints Steven and I had come up with. His final viz was so good, it made me rethink my entire design.

Having been inspired by a number of sources, I present a fourth option (very close to Chris' solution but with a slight tweak). I have build a sample viz that shows how to use formulas and table calculations to autoscale and autoalign shapes (or visualizations as Chris will show) to a grid based on how many values are available. Check out the final result below.


HOW TO

In my original sports viz, I was unaware that Tableau will do the sizing and arranging work for you if you have rows and columns that the images will fit in.  So here's how to use a unique ID column to auto generate the links we need

1) Create 'Y Axis' Field

INT((INDEX()-1)/ ROUND(SQRT(SIZE())))

So what is going on here?  The idea is that as the number of objects to display is usually best represented in equal rows and columns.  Thus, the number of rows we want (represented on the Y axis) should be the square root of the objects/dimension values.  The INDEX() -1 offsets the values so they continue to line up instead of shifting out.

2)  Create 'X Axis' Field

INDEX() - (INT((INDEX()-1)/ROUND(SQRT(SIZE())))) * ROUND(SQRT(SIZE()))

This one is a bit more complicated, but is to continue to hit on the idea of displaying equal number of rows and columns.  So with the 'Y Axis' figuring out a bucket for values for the row, the X axis needs to reassign the ID for the value so that the rows start over successfully.

So what this formula is doing is taking the current index value, subtracting the y axis bucket multiplied by the bucket value to always reestablish the new set of rows.

3) Build sheet and assign shapes

The setup is as follows
a) [ID] goes in the details
b) 'X Axis' goes on the columns shelf, convert to discrete
c) 'Y Axis' goes on the rows shelf, convert to discrete
d) 'Y Axis' and 'X Axis' should be addressing every field (see second screenshot for the how to)
a), b), & c)
d)
Let me know if this is helpful or if you have any questions.  Thank you!

Wednesday, September 10, 2014

How to Embed Streaming Web Content in Tableau

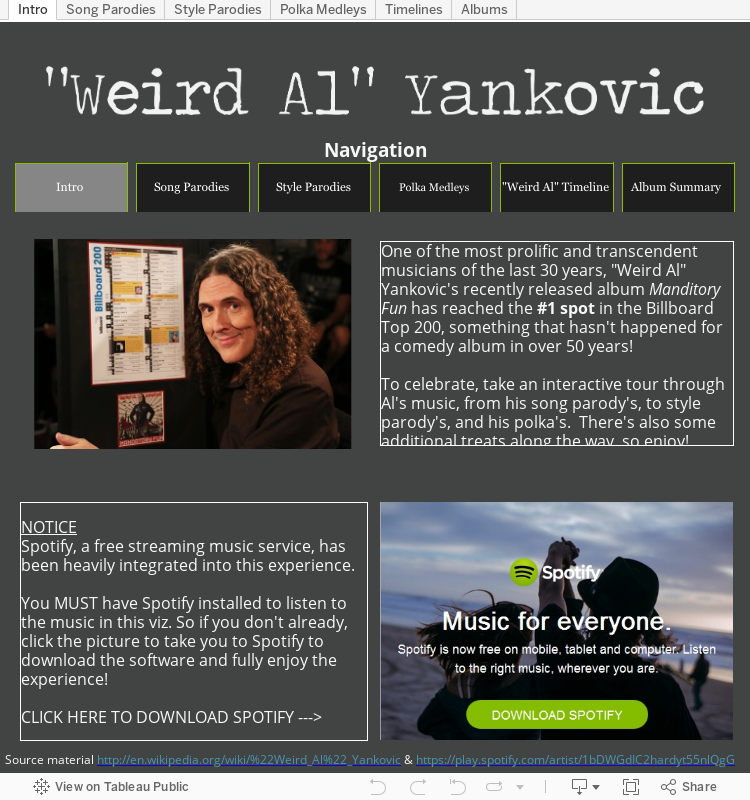
Tableau is a great, if not the best, tool for building data visualizations.  But what the tool also includes is the ability to display content from the internet right in your viz!  Here is the how to for streaming that content, and I will be using my "Weird Al" viz as the template for this.

1. Build the Data Set

If you want an interactive viz that dynamically displays different web content, you first need to build a data set that shows the different components you want to stream.  In the case of "Weird Al", I wanted to stream his individual songs and albums, so I went to Wikipedia for his discography and copied it into a spreadsheet. 

  • Just like any other Viz, a content viz is still data driven, so be sure you have the most robust/cleanest data you can work with
Album data with various attributes
Song data with various attributes

2. Gather the web links

In a "How-To" guide that allowed me to even build out this idea, +Ben Jones wrote about embedding YouTube into Tableau.  The key is that regardless of your content source (YouTube, Spotify, Soundcloud, etc), you want to find the 'embed' url to leverage in your dashboard.  In Spotify, these can be found by right clicking on a song and selecting 'Copy Embed Code'
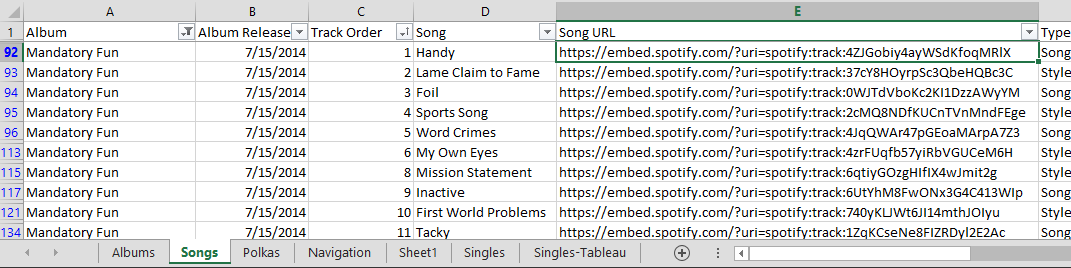
The resulting code will look something like this, and the URL that you want is highlighted in yellow: <iframe src="https://embed.spotify.com/?uri=spotify:track:4ZJGobiy4ayWSdKfoqMRlX" width="300" height="380" frameborder="0" allowtransparency="true"></iframe>

That URL can be copied to your Excel data like so
It is very important to line up the correct URL to the correct record in the data

  • Regardless of web source (YouTube, Spotify, Soundcloud, etc), identify the Embed url the desired content, and include that in your data source

3. Build a Dashboard That Will Stream the Web Content

In your viz, design your dashboard however you wish.  For the "Weird Al" viz, I wanted people to be able to select an image of the original artist and then be able to play that song.  Here is what the resulting Tableau sheet looks like
The field containing the URL needs to be in the details of the worksheet
In the dashboard, add the worksheet as well as a Web Page item.

After adding Web Page, select 'OK' to continue.  It's okay to leave it blank
With the URL is part of the details, the URL can be triggered from the dashboard via an action.
Add the sheet to a dashboard, then select Dashboard -> Action
The type of Action to add is a URL action
Check off the sheets you want the action to work from, and then select the field that contains the URL you wish to stream.
Select the arrow, then select the field that has the URL
After that, you can now stream by making a selection on the specified sheets (in this case Parody Song - Images and Parody Song - Lists) and the url listed in the data will appear in the web part.

  • After placing a Web Page part on your dashboard, you can use a URL Dashboard Action to pull the streaming content from the selected data point.

BONUS POINT. Custom Hyperlink Text

In the section above, the url action was delivered using a 'Select' URL action.  That means when a component of the specific worksheet is clicked on then the action will take place.

Tableau also offered 'Menu' actions, meaning that when you hover a specific data point, a URL link appears in the tooltip for you to select.  The advantage here is that you can variablize the text in the tool tip.  For example, the links could looks something like this...

This is easy enough to do.  Start with the URL action just like before

Select the 'Menu' action, and whatever you put in the Name will be what's displayed to the user.  You can even variablize the name by including values from the data, in this case Song title.


  • Actions can be selection or text based.  The text based actions, however, can be customized to display a message to the user relevant to the data point they are hovering on.

Conclusion: Steaming Web Content is Easy and Awesome in Tableau!
So there you have it, a breakdown of the how to embed steaming web content in your Tableau dashboard.  Check out the original viz for the interactive experience.


Thursday, July 31, 2014

Weird Al FTW

My enthusiasm for "Weird Al" started back in 1996 when I was at a friends house and he played the "Bad Hair Day" album for me.  I didn't know any of the regular songs, but I thought everything he did was super funny and also made me dance around the house.  As time went on, I was able to see him live twice (a must do for anyone) and somehow at every stage of life, I've found other people who enjoy listening to Al as well.  

To celebrate his latest album, "Mandatory Fun" and it's climb to #1 on the Billboard charts, I have created  a viz to show off how much Al has accomplished and give the user a way to interact with his music like never before.  

Hope you enjoy!


Thursday, April 24, 2014

Tableau Data Blending with No Common Dimensions

Sometimes when you're working with data, there is a need to compare datasets that don't really have anything in common.  This issue came up with my Sports Viz Show Me The Money: I had a dataset that contained the top 100 earning athletes in 2013 and I wanted to show what their pay could buy for them at an individual item level with out creating an unnecessary Cartesian product..  
Athlete data: a single row per athlete
As Gru would say: Light bulb!  If I create a data set containing a row for each purchasable item repeated the maximum amount of times it would appear (aka the number of times the top earning athlete, in this case Tiger Woods, would be able to purchase it), then I could write a calculated field that blended the two sources and did my filtering for me.

Stuff to buy data: note there is no column mentioning athlete
Doing this gave me two data sets: one that was 100 rows deep and the other just over 5,000 rows deep.

Next, after bringing in both data sets into Tableau, I created a cross dataset calculated field on the 'Stuff to Purchase' dataset that would allow me to filter out when the number of items exceeded the athletes pay.
running_sum(sum([Cost]))<=sum([Forbes 100 Athletes].[Pay $])
This way when I add the purchase able items at a data level, it will continue to referenced the accumulated value of the purchases and restrict them to only total that is less than the salary of the specified athlete.

Finally, I added
- RowID into the details
- 'How Many' true false filter to the filter section
    - IMPORTANT: Change the 'Compute Using' to use RowID
- Add the purchase category and item to the filter section
- Added the object's description to shape
- Filtered it for the specified athlete (from the secondary source).
   - This ultimately ended up being a quick filter that allowed me to select different athletes

Now I had my sheet that showed each of the items that the person could buy.
 If I had joined them ahead of time, I would have had a Cartesian product of over 160,000 rows!  This not only saved me data space, but also cut down on the data prep I needed to get dashboard built.  

So the answer all along (to the question that was never asked) was yes, it will blend...even if there are no common dimensions.  Let me know if you have any other questions and feel free to comment.  Thank you!

Wednesday, March 19, 2014

Ready, Set, #IronViz

March is Sports Blogging Month at +Tableau Software.  If you have ever visited my blog before, you know that's definitely the kind of blogging I can get behind (all but 2 of my vizzes have related to sports).

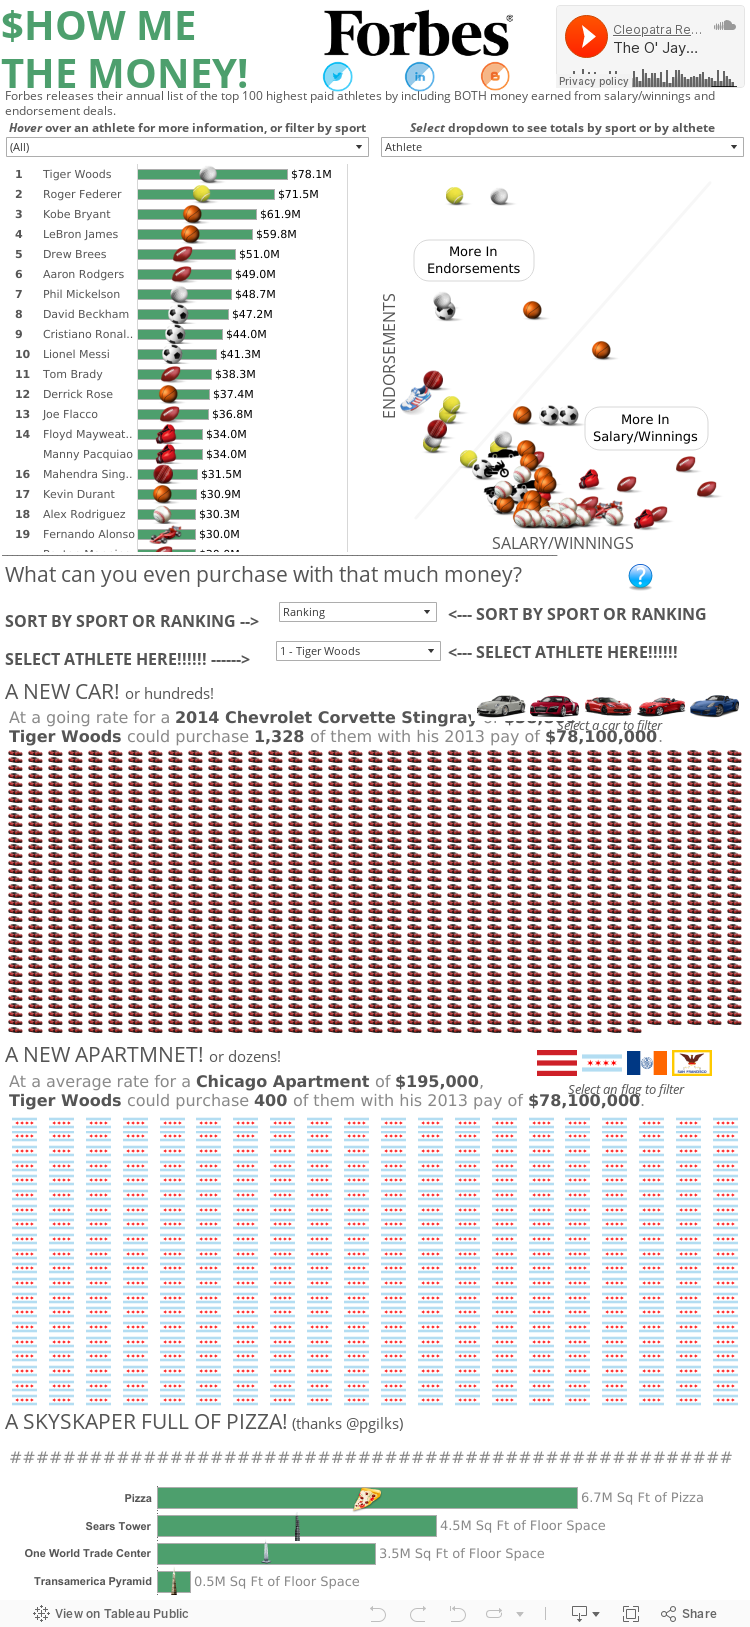
So here is my official submission for the sports blogging month and #IronViz sports blogging challenge.  Forbes publishes a list of the top 100 earning athletes and in addition to finding insight into HOW these athletes earn their money (endorsements vs salary/winnings), I tried to put a picture around what exactly $78 million dollars translates to (answer: a lot!). 

So enjoy and feel free to comment or let me know if you have any questions.  Thanks!


Wednesday, January 22, 2014

New To Data Blogging: 3 Lessons 3 Months In

When +Ben Jones announced Data Blogging Month, I thought about if I should write anything on the subject or not.  I've only started blogging about 3 months ago, so I'm still very new to this space.  Plus, after learning more about the Tableau Public community, I'm continually humbled by what I see the community put out and feel like I always have things I can be learning.

But this may also be an opportunity to turn an apparent weakness into a strength: I have the perspective of someone new to the game who is trying to establish a voice and presence while encountering some early bumps in the road.  I've probably learned more in the past 3 months than I had in my previous 3 years of using Tableau (kicked off with a schooling by Nelson Davis), and maybe these are the same things that others are going through in their early experience of getting into +Tableau Software Blogging.


1. The Story Being Told Is Paramount

This may seem like the most fundamental concept of data visualization, but is also the very thing that is easiest to lose sight of.  In the midst of getting your worksheet perfect and leveraging Tableau's capabilities (not to mention thinking about getting views/retweets/reposts), it becomes very easy to resort to "this will look cool" or "look at how smart I am" types of worksheets that ultimately end up confusing the user and turning people away from the viz...  

...and the tool won't get in your way from doing it.  Tableau is so developer friendly, there is no disincentive to complicate.  I can't count the number of times I've been building and thought along the lines of "It'll look better when I color the line with this metric, or size it with another metrics, or throw in a table calc".  Only later, when showing it to someone and they can't understand what in the hell is going on, does this come back to bite you.

The story you are telling grounds you.  Even when you are absolutely lost, are suffering writers block, or aren't feeling creative, the story you are telling is what re-engages and brings you back to focus.  An engaging story, even if it doesn't have as many bells and whistles, is will keep users looking and sharing.  Don't be a Sheldon and push people away with how smart you think you are.

2. Great Design Takes Time (And Lots Of Iteration)

A goal in the next month is to film how long it takes me to make a dashboard that I publish on Tableau Public.  The idea being that even with the ability to create insight in 3 minutes, I would guess that I spend about 15-30 HOURS of development, and countless more hours even thinking about it, before I get to a Viz that I post up.  The dashboards that win Viz of the Day probably go through the later process more so than the former process.

I may be on the slower end (it's not really something I've polled other developers about), but all of that time is spent in a number of different ways
  • I probably create 8-12 worksheets to investigate my data before getting to the 3-4 worksheets in my final viz
  • I'll wish I had more data to answer a question, so then I need to research and find that additional data and bring it into my workbook
  • I'll play with the layout of my dashboard in numerous different combinations
  • I add too much content and now I need to pear it down
  • If there's text, I'm constantly rewording to hit the message while taking up as little space as I can 
  • I'll mess with different color pallets to see if there are better color combinations (FYI: Cyclic is the bomb!)
  • I share drafts with peers and iterate based on their notes 
It may be inefficient, but I reassure myself with a quote from the #TCC13 keynote: "The great discoverers are jazz artists— they combine logic with intuition." Discoverers feel, they chase, they shift perspectives and they relate different ideas."  My overall time may be longer than others, but I would put money that the great final products didn't come together exactly as you see them.  Rather, they were the result of exploration, revision, and polish.

3. Your Blog Is About You, Not Your Audience

The beautiful thing about the internet is the ability to instantly share your thoughts and receive feedback with a global audience in near real time.  I can publish a post, tweet it, and start hearing from others in less than 10 minutes.  That tight feedback loop can dig into our own image of ourself.  Early on, I fell into the trap of being crushed when I didn't instantly have thousands of retweets or get a million comments.  Even after winning Viz of the Day with my Mike Ditka Viz, life moved on and the next day there was a new Viz of the Day (won by my very talented colleague +Peter Gilks none the less).

Now, I'm not saying that being recognized isn't a big deal.  Winning Viz of the Day was a huge honor; something I'm still very proud of and grateful for.  I'll never forget jumping up and down when someone who I didn't know (ended up being +Steph Stradley) retweeted one of my first posts.  But getting lost in the idea that "everything I do has to win/be retweeted/get views" became more important than "design something that efficiently tells a story and relays my passion for a topic".

Refocusing my efforts back to the process of telling stories that I'm passionate about, and less about the results of those efforts has made the experience enjoyable again.  I still reach out for feedback from my talented colleagues at +Slalom Consulting and I look at what the +Tableau Software community, especially the Tableau Zen Masters, are producing (my current favorite being +Kelly Martin and her VizCandy blog) to continue to refine my skills.  But at the end of the day, my blog is mine; something I do to share my interests in a way that maximizes/sharpens not only my Tableau skills, but also my design skills.

Conclusion

Maybe I'm wrong.  Maybe I'm the only guy who gets lost in rabbit holes of features instead of story.  Maybe I'm the only one who takes forever to get my viz's together.  Maybe I'm the only self deprecating narcissist on the internet.  Either way, these all were lessons that I had to learn (and continue to relearn) to be confident and okay with putting myself and my passions out for the world to look at (or ignore).  I've improved my Tableau skills beyond where they were before I started and I'm looking forward to what the Tableau Public community (myself included) can produce in the time to come.  Thank you.

Tuesday, January 14, 2014

Defense vs Offense: A Chicago Bears Coaching Transition

In January 2013, the +Chicago Bears  made the largest coaching philosophy transition when they fired Lovie Smith after a 10-6 season and hired Marc Trestman from the CFL.  

How did their back-to-back seasons compare? Check out the viz below for more information.

UPDATE: As pointed out by my brother +Matt Montgomery , there are two other reasons to be excited for the +Chicago Bears that I will try to incorporate into the viz.
1. Top Offenses > Top Defenses via AdvancedNFLStats
2. Offense is more consistent than Defense, year to year via FootballOutsiders

Monday, December 23, 2013

Tableau #3minwin

I created an entry for the Tableau #3minwin competition.  I built this dashboard in under 3 minutes using NFL weather data (and some data from Pro-Football-Reference) and I've included the youtube video to prove it.  Enjoy!


Wednesday, December 18, 2013

Nuclear Power's Effect On Carbon Dioxide Emissions

Some may know this, but my undergrad was actually in Nuclear Engineering.  While I do not necessarily practice it day to day (as I'm sure most people say of their undergrad education), I certainly walked away with a real passion for the benefits of nuclear energy.  It has the ability to generate electricity on the hundred megawatt or even gigawatt level (on par or better than existing fossil fuel plants), produces no carbon dioxide, and properly maintained plants produce no additional radiation to the surrounding area, among many other benefits.

Inspired by +Hans Rosling (the +Tableau Software TCC14 keynote speaker) and the work at Gapminder, I built a dashboard that tells the story of how countries that embrace nuclear energy (especially France) have seen a reduction in their carbon dioxide emissions, while countries that have little or no nuclear presence are seeing large increases in their carbon dioxide emissions.  

If you would like to learn more about nuclear power, there was also a documentary that was shown on CNN called Pandora's Promise, which interviews well known environmentalists that now support nuclear energy and investigates nuclear power from a variety of different angles.

Enjoy and feel free to comment below.


Monday, December 16, 2013

A Single Pixel (Or Hide) Can Save Your Tableau Viz

UPDATE: After posting this in the Tableau Tips and Tricks community, +Shawn Wallwork pointed out an alternative to my solution that is built right into Tableau.  It was a lesson for me, so I wanted to share it here as well.

While working on my Mike Ditka dashboard (here and on Tableau Public), I had an interesting idea for 'Da Coach' viz: While showing a timeline of a particular coaches season records over time, I would also indicate if the coach had won a Super Bowl that year.

I had found a great site that had images of the Super Bowl logos and used a Chrome extension to download all of the them.  After making a shapes folder for the Super Bowl images in my Tableau Repository, I mapping the images to the coach-season combination that was appropriate.  This layered on top of a line chart started to become....

Ugh...so close, yet so far away
not what I was hoping for.  There were far more 'Null' values than images to display, and if I made the sizing smaller, the Super Bowl logos would not show up.

NEW METHOD: Tableau builds in a way to accomplish hiding the unwanted shapes.  

First, select (left click) the shape you want to hide.  This is CRITICAL because jumping this step will not get you the menu options you want.

Second, right click on the object you want to hide and check 'Hide'
REMEMBER: You will only see this option if you select the object to hide first!

If you ever need to see the data that you have hidden, you can select the drop down of the shape card, and select 'Show Hidden Data'

This accomplishes the same task as the original method, while also providing some additional space in the Viz.  But be sure to remember what you've hidden so you don't loose track of your data. 

ORIGINAL METHOD: Epiphany: what if I made the image for 'Null' values a single pixel?  That way, it will be so small it won't be seen as an image, and even if I need to make it bigger, it still will not be noticed.  
Sure enough, a website hosts an image of a transparent single pixel.  After downloading the image and saving it to my shapes folder, it was easy enough to assign: just hovering over they general area Tableau gave me a easy-to-select box.
Selecting a transparent single pixel inside of Tableau
Worksheet updated!

In the end this gave me the worksheet I was hoping for all along.  Maybe this will help you too in your next viz!  Take care.


Thursday, December 12, 2013

How Does Your Favorite NFL Team Spend Its Salary Cap?

NFL Teams are allotted a certain amount of money every year to spend on its players; that money is referred to as the salary cap.  A teams spends its salary cap on players base salaries, various bonuses, severed contracts, practice squad players, and penalties to the team.  Each team has to weigh the existing contracts with valued positions and potential contract extensions before hiring and releasing players.  

Use the visualization below to better understand how your favorite NFL spends its salary cap.  You can select a team, a position, or a player to learn more about the respective team expenses.  

Enjoy and feel free to comment below.


Tuesday, December 10, 2013

Viz of the Day!

Today I was very honored to find out I had won Tableau Public's Viz of the Day, a daily selection of cool dashboards built and hosted on Tableau Public. I am very excited to get the Mike Ditka dashboard up and in front of people, showing the impact of a Chicago Bears legend.

I even got to go to the game last night to watch his number get retired at the game with my dad!  It was bitterly cold, but a fantastic 45-28 win over the Cowboys.

My Dad and I at the Bears-Cowboys game, 12/9/2013. Ditka's number was retired at halftime.


Thank you everyone who liked and shared the viz.  It has been a crazy couple of days, but very exciting.  Take care.