Thursday, July 31, 2014

Weird Al FTW

My enthusiasm for "Weird Al" started back in 1996 when I was at a friends house and he played the "Bad Hair Day" album for me.  I didn't know any of the regular songs, but I thought everything he did was super funny and also made me dance around the house.  As time went on, I was able to see him live twice (a must do for anyone) and somehow at every stage of life, I've found other people who enjoy listening to Al as well.  

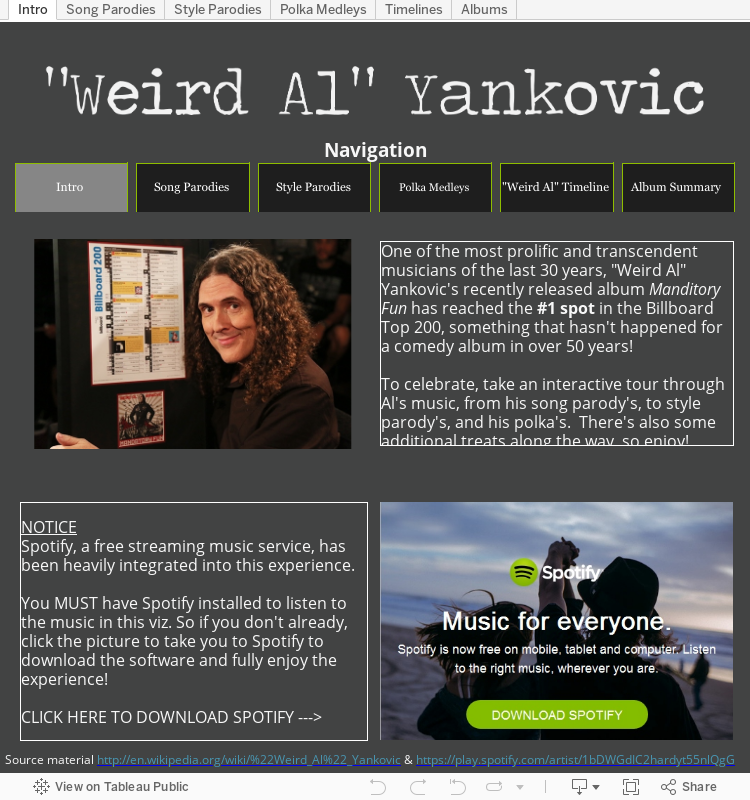
To celebrate his latest album, "Mandatory Fun" and it's climb to #1 on the Billboard charts, I have created  a viz to show off how much Al has accomplished and give the user a way to interact with his music like never before.  

Hope you enjoy!


Thursday, April 24, 2014

Tableau Data Blending with No Common Dimensions

Sometimes when you're working with data, there is a need to compare datasets that don't really have anything in common.  This issue came up with my Sports Viz Show Me The Money: I had a dataset that contained the top 100 earning athletes in 2013 and I wanted to show what their pay could buy for them at an individual item level with out creating an unnecessary Cartesian product..  
Athlete data: a single row per athlete
As Gru would say: Light bulb!  If I create a data set containing a row for each purchasable item repeated the maximum amount of times it would appear (aka the number of times the top earning athlete, in this case Tiger Woods, would be able to purchase it), then I could write a calculated field that blended the two sources and did my filtering for me.

Stuff to buy data: note there is no column mentioning athlete
Doing this gave me two data sets: one that was 100 rows deep and the other just over 5,000 rows deep.

Next, after bringing in both data sets into Tableau, I created a cross dataset calculated field on the 'Stuff to Purchase' dataset that would allow me to filter out when the number of items exceeded the athletes pay.
running_sum(sum([Cost]))<=sum([Forbes 100 Athletes].[Pay $])
This way when I add the purchase able items at a data level, it will continue to referenced the accumulated value of the purchases and restrict them to only total that is less than the salary of the specified athlete.

Finally, I added
- RowID into the details
- 'How Many' true false filter to the filter section
    - IMPORTANT: Change the 'Compute Using' to use RowID
- Add the purchase category and item to the filter section
- Added the object's description to shape
- Filtered it for the specified athlete (from the secondary source).
   - This ultimately ended up being a quick filter that allowed me to select different athletes

Now I had my sheet that showed each of the items that the person could buy.
 If I had joined them ahead of time, I would have had a Cartesian product of over 160,000 rows!  This not only saved me data space, but also cut down on the data prep I needed to get dashboard built.  

So the answer all along (to the question that was never asked) was yes, it will blend...even if there are no common dimensions.  Let me know if you have any other questions and feel free to comment.  Thank you!
Wednesday, March 19, 2014

Ready, Set, #IronViz

March is Sports Blogging Month at +Tableau Software.  If you have ever visited my blog before, you know that's definitely the kind of blogging I can get behind (all but 2 of my vizzes have related to sports).

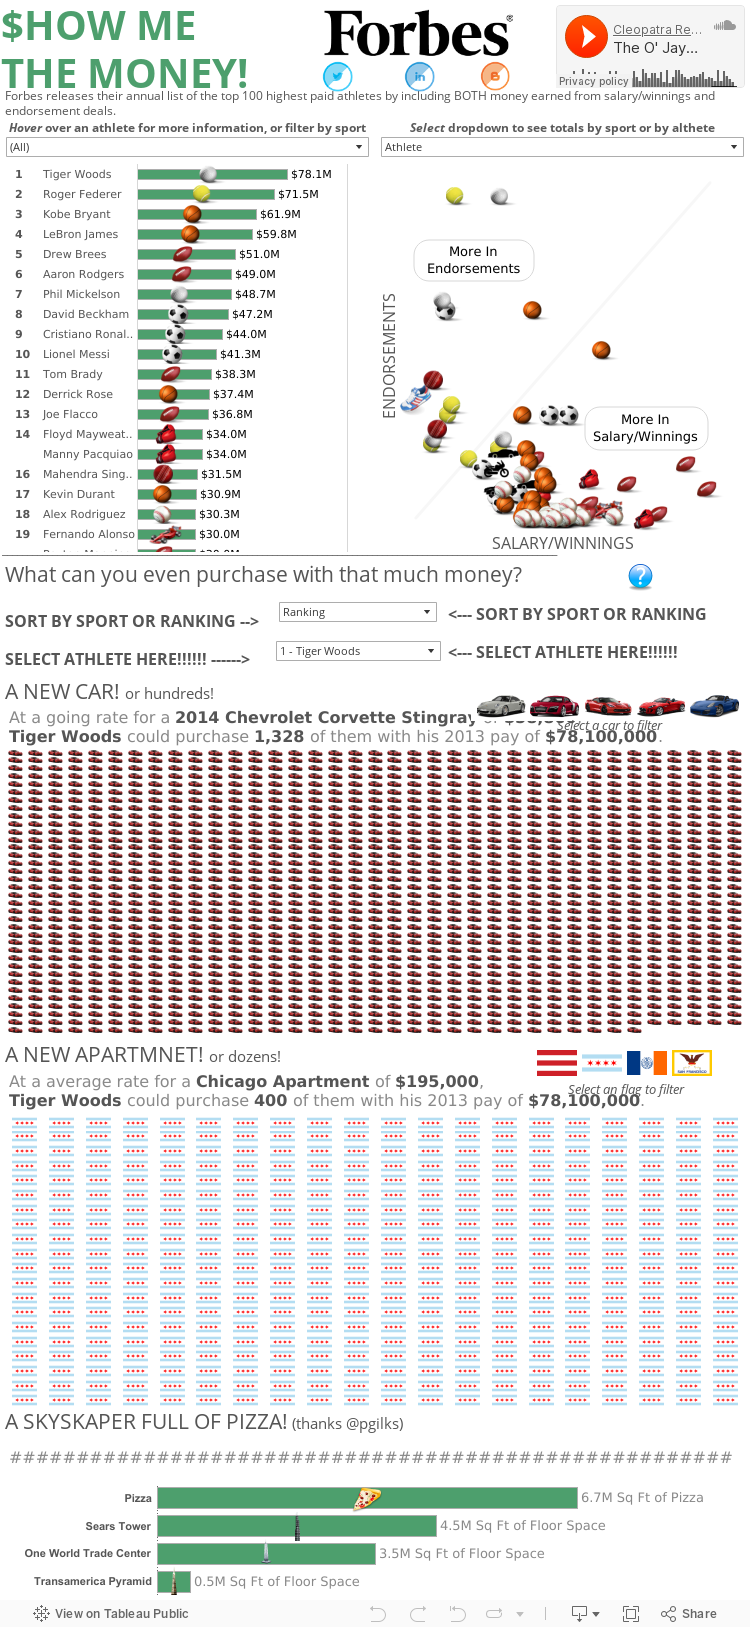
So here is my official submission for the sports blogging month and #IronViz sports blogging challenge.  Forbes publishes a list of the top 100 earning athletes and in addition to finding insight into HOW these athletes earn their money (endorsements vs salary/winnings), I tried to put a picture around what exactly $78 million dollars translates to (answer: a lot!). 

So enjoy and feel free to comment or let me know if you have any questions.  Thanks!


Wednesday, March 12, 2014

PowerShell and Tableau Server: Automating User Creation and Group Population

UPDATE: I corrected the link to enable secure password storage and recovery in PowerShell.  Apologies for the incorrect link.

As long as Tableau Server runs on Windows machines, an admin's best friend is to leverage PowerShell to automate some everyday tasks.  There have been other great articles on combining Tableau and PowerShell, like Automated PDF Email Distribution by the talented folks at +InterWorks.  

But what, for whatever reason, you need to take down a Tableau Server configured for Active Directory Authentication, restore it as Local Authentication, and recreate the existing users (because the users from a directory will not translate to local authentication).  

Why it just so happens that I have a sample script for that!  To do this, you will need the following items
  • An admin login and password for Tableau server 
  • A csv file with the existing users, their names, and potentially email address'
  • A csv file with the groups and their users
    • Both csv's can be generated using data from the PostgreSQL.  Read here for how to enable that (and search the forums for how to enable read access for all tables/views, not just the default ones!!!)
  • A will and desire to WIN! or just take an otherwise tedious task off your plate.
CLICK HERE for a working powershell script and sample documents.  This method stores the password in the script, though there is a secure method of accomplishing this listed here.

KEY TAKEAWAYS FOR POWERSHELL
Import-CSV: A very power cmdlet to read data from a csv and allow the script to 'play with the results'
select-object: Manipulate the results of a data set (perhaps coming from Import-CSV), much like you would with SQL
.\: This forces PowerShell to run traditional command prompt commands without prompting the user to accept it
foreach: Exact what the name suggests, iterate through every line of a dataset and run a series of commands

Thanks everyone.  Take care and let me know if you have any questions.

Thursday, February 27, 2014

#VizYourLife: Moving to San Francisco

Not that anyone's holding their breath, but it's been over a month since I posted any content on my blog.  In that time, I did the following

  • Said goodbye to the city I've lived in for 28 years (minus college)
  • Packed up almost of my belongings that would fit into my car.
  • Drove across the country to San Francisco
  • Started working the day after I've arrived
  • Slept or looked for an apartment nearly every minute I haven't been working
So needless to say I have been very busy, or just exhausted enough that I've put the blog on the back burner. 

However, here are some viz's based on my last month.

This is my 3 (really 4) day drive from Chicago to the Bay, stopping Nebraska, Utah, and Sacramento
California is currently experiencing a crazy drought, though it was down pouring when I got into Tahoe
Chicago has more negative equity...
...and SF is just insanely expensive.

Chicago real estate is in higher foreclosure, California real estate is just insanely expensive.

And while Chicagoans are very proud of their food, San Francisco is not as hippie-dippie vegan/vegetarian as people seem to think they are.

Pizza, hot dogs, chili...yeah that sounds right
A burger right off the bat, follow by a Cioppino, which looks like an awesome seafood dish.

In short, sorry for the delays.  I'm still getting settled but I'm so glad to be out in the Bay and looking forward to blogging and meeting up with Tableau users.  

Take care, everyone.

Links:

Wednesday, January 22, 2014

New To Data Blogging: 3 Lessons 3 Months In

When +Ben Jones announced Data Blogging Month, I thought about if I should write anything on the subject or not.  I've only started blogging about 3 months ago, so I'm still very new to this space.  Plus, after learning more about the Tableau Public community, I'm continually humbled by what I see the community put out and feel like I always have things I can be learning.

But this may also be an opportunity to turn an apparent weakness into a strength: I have the perspective of someone new to the game who is trying to establish a voice and presence while encountering some early bumps in the road.  I've probably learned more in the past 3 months than I had in my previous 3 years of using Tableau (kicked off with a schooling by Nelson Davis), and maybe these are the same things that others are going through in their early experience of getting into +Tableau Software Blogging.


1. The Story Being Told Is Paramount

This may seem like the most fundamental concept of data visualization, but is also the very thing that is easiest to lose sight of.  In the midst of getting your worksheet perfect and leveraging Tableau's capabilities (not to mention thinking about getting views/retweets/reposts), it becomes very easy to resort to "this will look cool" or "look at how smart I am" types of worksheets that ultimately end up confusing the user and turning people away from the viz...  

...and the tool won't get in your way from doing it.  Tableau is so developer friendly, there is no disincentive to complicate.  I can't count the number of times I've been building and thought along the lines of "It'll look better when I color the line with this metric, or size it with another metrics, or throw in a table calc".  Only later, when showing it to someone and they can't understand what in the hell is going on, does this come back to bite you.

The story you are telling grounds you.  Even when you are absolutely lost, are suffering writers block, or aren't feeling creative, the story you are telling is what re-engages and brings you back to focus.  An engaging story, even if it doesn't have as many bells and whistles, is will keep users looking and sharing.  Don't be a Sheldon and push people away with how smart you think you are.

2. Great Design Takes Time (And Lots Of Iteration)

A goal in the next month is to film how long it takes me to make a dashboard that I publish on Tableau Public.  The idea being that even with the ability to create insight in 3 minutes, I would guess that I spend about 15-30 HOURS of development, and countless more hours even thinking about it, before I get to a Viz that I post up.  The dashboards that win Viz of the Day probably go through the later process more so than the former process.

I may be on the slower end (it's not really something I've polled other developers about), but all of that time is spent in a number of different ways
  • I probably create 8-12 worksheets to investigate my data before getting to the 3-4 worksheets in my final viz
  • I'll wish I had more data to answer a question, so then I need to research and find that additional data and bring it into my workbook
  • I'll play with the layout of my dashboard in numerous different combinations
  • I add too much content and now I need to pear it down
  • If there's text, I'm constantly rewording to hit the message while taking up as little space as I can 
  • I'll mess with different color pallets to see if there are better color combinations (FYI: Cyclic is the bomb!)
  • I share drafts with peers and iterate based on their notes 
It may be inefficient, but I reassure myself with a quote from the #TCC13 keynote: "The great discoverers are jazz artists— they combine logic with intuition." Discoverers feel, they chase, they shift perspectives and they relate different ideas."  My overall time may be longer than others, but I would put money that the great final products didn't come together exactly as you see them.  Rather, they were the result of exploration, revision, and polish.

3. Your Blog Is About You, Not Your Audience

The beautiful thing about the internet is the ability to instantly share your thoughts and receive feedback with a global audience in near real time.  I can publish a post, tweet it, and start hearing from others in less than 10 minutes.  That tight feedback loop can dig into our own image of ourself.  Early on, I fell into the trap of being crushed when I didn't instantly have thousands of retweets or get a million comments.  Even after winning Viz of the Day with my Mike Ditka Viz, life moved on and the next day there was a new Viz of the Day (won by my very talented colleague +Peter Gilks none the less).

Now, I'm not saying that being recognized isn't a big deal.  Winning Viz of the Day was a huge honor; something I'm still very proud of and grateful for.  I'll never forget jumping up and down when someone who I didn't know (ended up being +Steph Stradley) retweeted one of my first posts.  But getting lost in the idea that "everything I do has to win/be retweeted/get views" became more important than "design something that efficiently tells a story and relays my passion for a topic".

Refocusing my efforts back to the process of telling stories that I'm passionate about, and less about the results of those efforts has made the experience enjoyable again.  I still reach out for feedback from my talented colleagues at +Slalom Consulting and I look at what the +Tableau Software community, especially the Tableau Zen Masters, are producing (my current favorite being +Kelly Martin and her VizCandy blog) to continue to refine my skills.  But at the end of the day, my blog is mine; something I do to share my interests in a way that maximizes/sharpens not only my Tableau skills, but also my design skills.

Conclusion

Maybe I'm wrong.  Maybe I'm the only guy who gets lost in rabbit holes of features instead of story.  Maybe I'm the only one who takes forever to get my viz's together.  Maybe I'm the only self deprecating narcissist on the internet.  Either way, these all were lessons that I had to learn (and continue to relearn) to be confident and okay with putting myself and my passions out for the world to look at (or ignore).  I've improved my Tableau skills beyond where they were before I started and I'm looking forward to what the Tableau Public community (myself included) can produce in the time to come.  Thank you.

Tuesday, January 14, 2014

Defense vs Offense: A Chicago Bears Coaching Transition

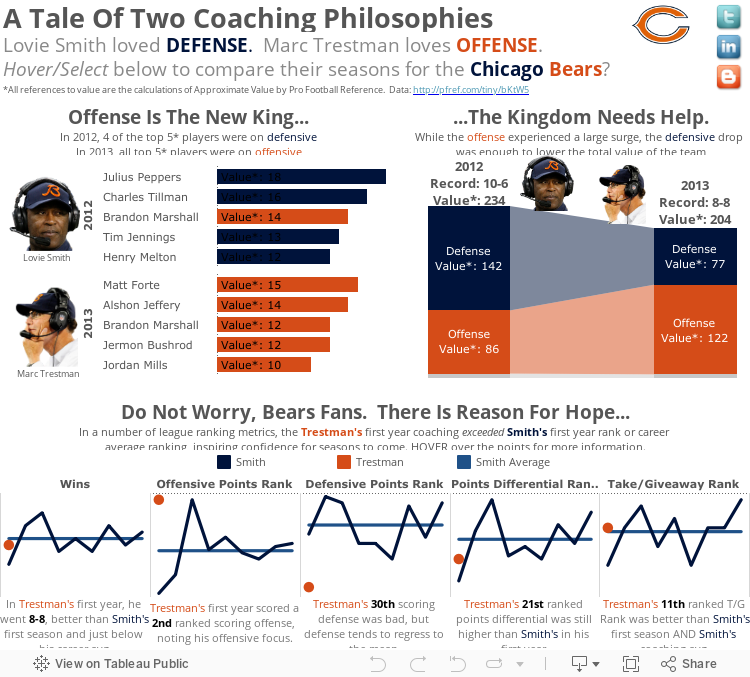
In January 2013, the +Chicago Bears  made the largest coaching philosophy transition when they fired Lovie Smith after a 10-6 season and hired Marc Trestman from the CFL.  

How did their back-to-back seasons compare? Check out the viz below for more information.

UPDATE: As pointed out by my brother +Matt Montgomery , there are two other reasons to be excited for the +Chicago Bears that I will try to incorporate into the viz.
1. Top Offenses > Top Defenses via AdvancedNFLStats
2. Offense is more consistent than Defense, year to year via FootballOutsiders